For a sustainable ecosystem to materialise there is a need for handholding by the government and it is high time for the policy makers to start looking at instruments that can strengthen the R&D ecosystem.
The two world wars, the cold war which followed and the side of the iron curtain the participating countries fell, have largely defined the two major R&D ecosystems observable today. The western block with its free market economic model was able to seamlessly pass the baton to the private sector and what followed was a thriving ecosystem dominated by the private firms. The countries on the eastern side of the curtain witnessed a government run and dominated R&D investment regime with the major focus on security needs and hardly any focus on monetisation thereby rendering the R&D ecosystem unsustainable. The rest of the world has been playing catch as these countries surely enjoy the first movers advantage. We know the western block today as the Organisation for Economic Co-operation and Development (OECD), headquartered at Paris, France. There have been some additions over the years with the fall of the iron curtain but the core remains the same.
As of October 2021 the group is comprised of 38 mostly high income democratic countries, which as a general principle support free market economy. The OECD countries spend on an average 2.47% of their GDP on R&D activities; with Mexico (0.28%) and Colombia (0.32%) holding the lower end of the range and Israel (4.93%) along with Korea (4.64%) pulling at the higher end (2019 OECD data). Even on an average basis the OECD countries outperform a country of the size (economic, geographic & demographic) of India, which is hovering around the 0.7% mark of Gross Expenditure on R&D (GERD) as a % of GDP. So, where do we lack and what lessons can we learn from the western model and what pitfalls do we need to avoid? What the market desires and needs is a question worth pondering upon under this light.
The markets of the OECD countries prefer cash grants (70% of the listed countries providing this incentive), patent related incentives (52%), tax credits (76%), and tax deductions including super deductions (58%). When we compare this with the preferred policy instruments in non-OECD countries which do not follow the free market model, the preference of governments shifts towards providing accelerated depreciation on R&D assets (53% of the countries), reduced tax rates/preferable tax rates (60%), tax deductions including super deductions (80%), tax exemptions (47%), and tax holidays (53%). None of the countries considered in the report, whether OECD or non-OECD had a preference for the instrument of expedited government approvals. On an average the OECD countries preferred the instrument of providing easy loans (42%) as compared to non-OECD countries with a figure of 27% only (The Worldwide R&D Incentives Reference Guide 2020).
| Table 1: Average of policy instruments for 32 OECD and 15 non-OECD countries. | |||
| Interventions | Others Avg. | OECD Avg. | India |
| Accelerated Depreciation on R&D Assets | 0.53 | 0.24 | 0 |
| Cash Grants | 0.33 | 0.7 | 1 |
| Financial Support | 0.27 | 0.3 | 1 |
| Infrastructure/ and preferrential Price | 0.07 | 0.06 | 0 |
| Loans | 0.27 | 0.42 | 1 |
| Patent-related incentives | 0.33 | 0.52 | 1 |
| Reduced Social Security Contributions | 0.2 | 0.21 | 1 |
| Reduced tax rates / preferable tax rates | 0.6 | 0.3 | 1 |
| Tax credits | 0.2 | 0.76 | 0 |
| Tax deduction (including super deduction) | 0.8 | 0.58 | 1 |
| Tax exemptions | 0.47 | 0.3 | 0 |
| Tax holidays | 0.53 | 0.15 | 1 |
| Analysis performed by the researchers at IFC on the data made available by the Worldwide R&D Incentives Reference Guide 2020, published by EY. |
It appears that the preferred policy instruments for the OECD countries are cash grants, patent related incentives, tax credits, and loans and these instruments seem to be working very well to sustain the R&D ecosystem of these countries. Also being free market economies, these preferences can very well be considered a metric of what the private sector desires in terms of policy instruments to boost R&D investment. The non-OECD countries are more tilted towards tax based incentives which only come into play once the R&D activities have already been initiated by the private players. This signals a bias in favour of the existing players and against the new entrants in the R&D sphere. Surely, more of handholding and a launchpad based approach is required to give the private players a head start in this field. Another metric which analyses the strength of an R&D ecosystem is the amount of manpower employed in R&D activities and their distribution across business, government, and higher education enterprises.
The OECD countries with an average figure of 6925 for total R&D personnel per million inhabitants (TRDP-PMI) outperform by a huge margin four non-OECD major R&D players (China, Russia, Bulgaria, & Bosnia Herzegovina) having a TRDP-PMI of 3150. India lags far behind with a paltry figure of 408 TRDP-PMI. Not just absolute numbers but their distribution across the business, government and higher education sectors also matter while aiming for a sustainable ecosystem.
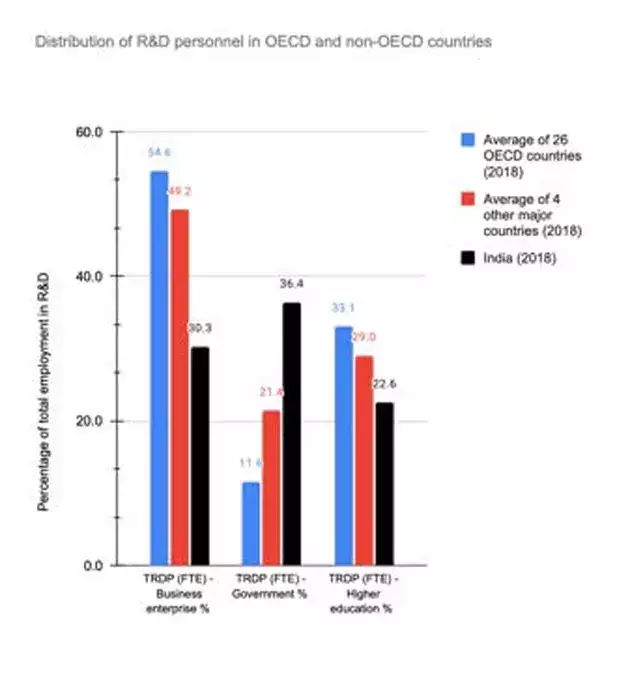
On an average 54.6% of R&D personnel in the 26 OECD countries considered are employed with the business sector whereas the Indian business employs less than one-third (30%) of the R&D personnel. While for the OECD and the other four major countries, the largest employer is the business sector (54.6% & 49.2% respectively), the major employer in India is the government itself; accounting for the highest share of total R&D personnel (36%). As is evident from the data, while the other major countries appear to be well on their path to achieve parity with the OECD countries; both in terms of the distribution of their R&D workforce and on TRDP-PMI, in the Indian case the workforce concentration is still government centric with a very low TRDP-PMI.
India does not provide the option of tax credits for R&D activities undertaken, otherwise its choices of policy instruments has started to mimic those of the OECD countries. Nevertheless the amount provided, through either cash grants or loans or the relief provided through tax incentives, has so far proven insufficient in making any substantial impact towards boosting the R&D ecosystem of the country. The workforce is still concentrated within the government run R&D enterprises. More collaboration between the private and the higher education sector, through a mixed-funding model would help in better absorption of the researchers into the private fold by the way of drastically reducing the labour and capital costs. Government funding of the research being done by the startups would help them raise funds from the open market as the vetting process reduces the information cost and provides credibility to the firms’ research. For a sustainable ecosystem to materialise there is a need for handholding by the government and it is high time for the policy makers to start looking at instruments that can strengthen the R&D ecosystem.
The article was published with Economic Times on October 27, 2021.
